Visualize Your Research
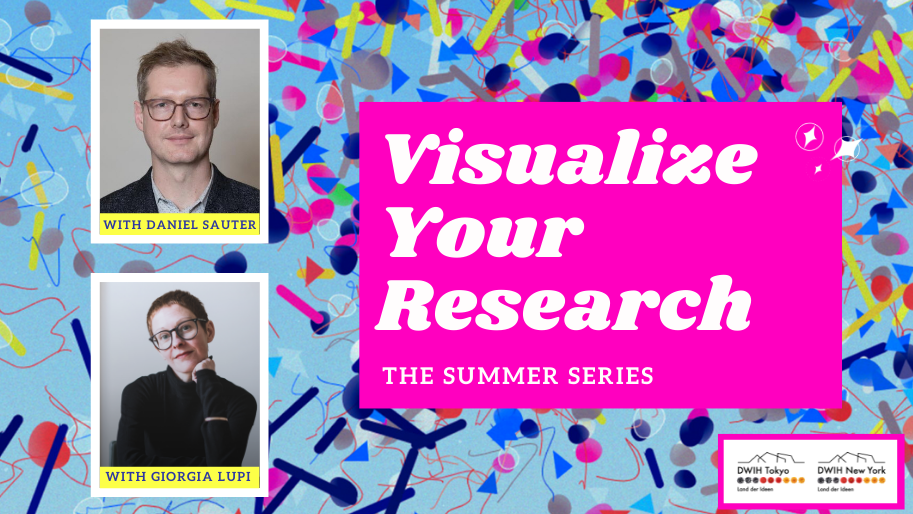
Join us for our exclusive summer series on data visualization. We’re offering an exclusive online talk by award-winning designer Giorgia Lupi, followed by an intensive student workshop lead by artist and professor of data visualization, Daniel Sauter.
Visualizing research results is more important than ever. Not only are we more used to images, graphs, and statistics in our environment, but well-designed images and illustrations can also convey and illuminate research results effectively – and persuasively.
The German Centers for Research and Innovation (DWIH) in New York and Tokyo, with collaboration from 1014, are proud to present the summer program “Visualize Your Research” through which you can obtain the skills necessary to visualize both quantitative and qualitative research – while connecting with young researchers in Japan, Germany and the US.
PART I: LECTURE
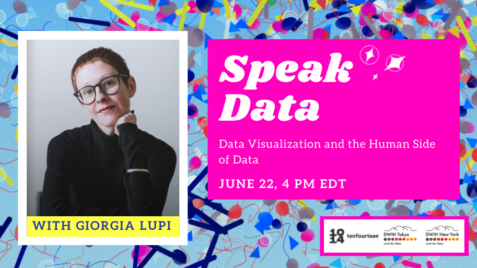
Offering inspiration and insights, information designer Giorgia Lupi will dive into her work and philosophy of “data humanism.”
Everyone is welcome to attend and can register here.
PART II: Workshops
A free, two-part workshop for graduate level students looking to acquire and improve their skills in data visualization.
Part I – “Dataviz for Aspiring Professionals” (July 23, 8 PM EDT)
Part II – “Telling Stories with Data” (August 20, 9 PM EDT)
Workshops are by application only and limited to 30 attendees. We’re looking for graduate students affiliated with a university in the U.S., Germany or Japan. Attendees must commit to producing and submitting a visualization.
Find out further details about the workshop here or contact events@dwih-newyork.org for more details.
Your Data Viz Experts:

Giorgia Lupi is an information designer and a Partner at Pentagram in New York. After receiving her master’s degree in architecture, she earned her PhD in design at Politecnico di Milano. In 2011, she co-founded Accurat, an internationally acclaimed data-driven design firm with offices in Milan and New York. She is co-author of Dear Data and the new interactive book Observe, Collect, Draw - A Visual Journal. Giorgia is also a public speaker, and her TED TALK on her humanistic approach to data has over one million views. She was named One of "Fast Company's" 100 Most Creative People in Business in 2018 and has distinctions from MIT Media Lab, the World Economic Forum and the Royal Society of Art. Her work is part of the permanent collection of the Museum of Modern Art.Award-Winning Information Designer

Daniel Sauter creates installations and visualizations dealing with the social implications of emerging technologies. His research is driven by a curiosity about how the computational regime transforms digital identity, geopolitics, and urban spaces. He is an Associate Professor at Parsons School of Design and the Director of the (MS) Data Visualization program. As Associate Director of the Urban Systems Lab, he is leading the Dataviz team in developing science communication and software. And as Co-Director of the Integrative PhD Fellowship Program, he is fostering integrated research in design and the social sciences at the New School in New York City. His collaborative works have been shown internationally, including the Whitney Museum of American Art, China Millennium Art Museum, Metropolitan Museum of Photography, LA County Museum of Art LACMALab and many others.Associate Professor of Data Visualization, The New School - Parsons
